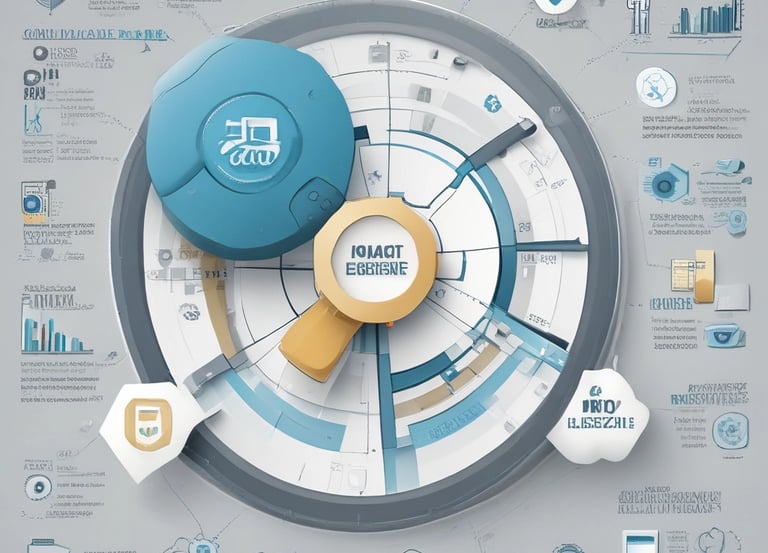
Services BI

Expertise en business intelligence pour valoriser vos données et stimuler votre croissance.

An abstract, pastel-colored, 3D-rendered representation of data analysis and search engine optimization (SEO). The image features a computer interface with various analytics symbols, including a magnifying glass, bar charts, pie charts, and a search bar with the text 'SEO'. Surrounding the interface are different objects such as a potted plant, a cup with a saucer, and a megaphone, all placed on a light green background.
A web page featuring a promotional message about creating mobile apps from data. The headline text emphasizes transforming data into beautiful, powerful mobile applications. Below the headline, there is an image of a smartphone interface displaying app previews with a toolbar and menu options. The user interface is sleek and modern with a soft pastel background gradient.
Architecture BI

Conception d'entrepôts de données performants et sécurisés pour une exploitation optimale de vos données.

Tableaux de bord

Développement de tableaux de bord interactifs pour un pilotage en temps réel et des visualisations claires.

Projets BI

Transformez vos données en leviers de croissance.

A laptop with an open screen displaying dashboard analytics featuring charts, graphs, and numerical data related to sales and subscriptions. The interface is predominantly dark-themed with sections highlighting key performance metrics. The device shown is a MacBook Pro, indicated by the keyboard layout and branding.
Architecture BI

Conception d'entrepôts de données performants et sécurisés pour une exploitation optimale.

A laptop displays a detailed financial chart with lines showing data trends. In the background, a person is partially visible, wearing a dark shirt with the words 'most valuable' and some logos printed on it. The setting appears to be a modern workspace.
Tableaux de bord

Développement de tableaux de bord interactifs pour un pilotage en temps réel et des visualisations claires.

Notre méthode en 4 étapes

a man riding a skateboard down the side of a ramp
2-Conception sur mesure

Architecture et choix des outils adaptés

3-Déploiement & intégration

Mise en place et formation des équipes

1-Audit & cadrage

Analyse de vos besoins et objectifs

4-Suivi & optimisation

Amélioration continue de vos solutions BI

Avis clients

Découvrez ce que nos clients pensent de nos services.

L'équipe d'Ariamdata a transformé nos données en un véritable atout stratégique. Leur expertise en BI est inégalée.

Sophie L.
A digital dashboard displaying various analytics charts and graphs. There is a line graph showing user engagement over time on the left, a section with total revenue marked as $74K, and bar charts illustrating user statistics by region. The central section highlights users in the last 30 minutes, focusing on different countries such as the United States, Canada, India, Pakistan, and Brazil.

Lyon

Nous avons vu une amélioration significative de notre prise de décision grâce aux tableaux de bord interactifs d'Ariamdata. Leur service est exceptionnel et très professionnel.

A laptop displaying a dashboard with various graphs, charts, and numeric data. The screen is partially visible, showcasing sections with line graphs, financial figures, and small images. The background is blurred with a prominent red light creating a warm ambiance.
Marc T.

Paris

★★★★★
★★★★★